

How Much Energy Does a Life Require?
On energy, well-being, and the question of enough


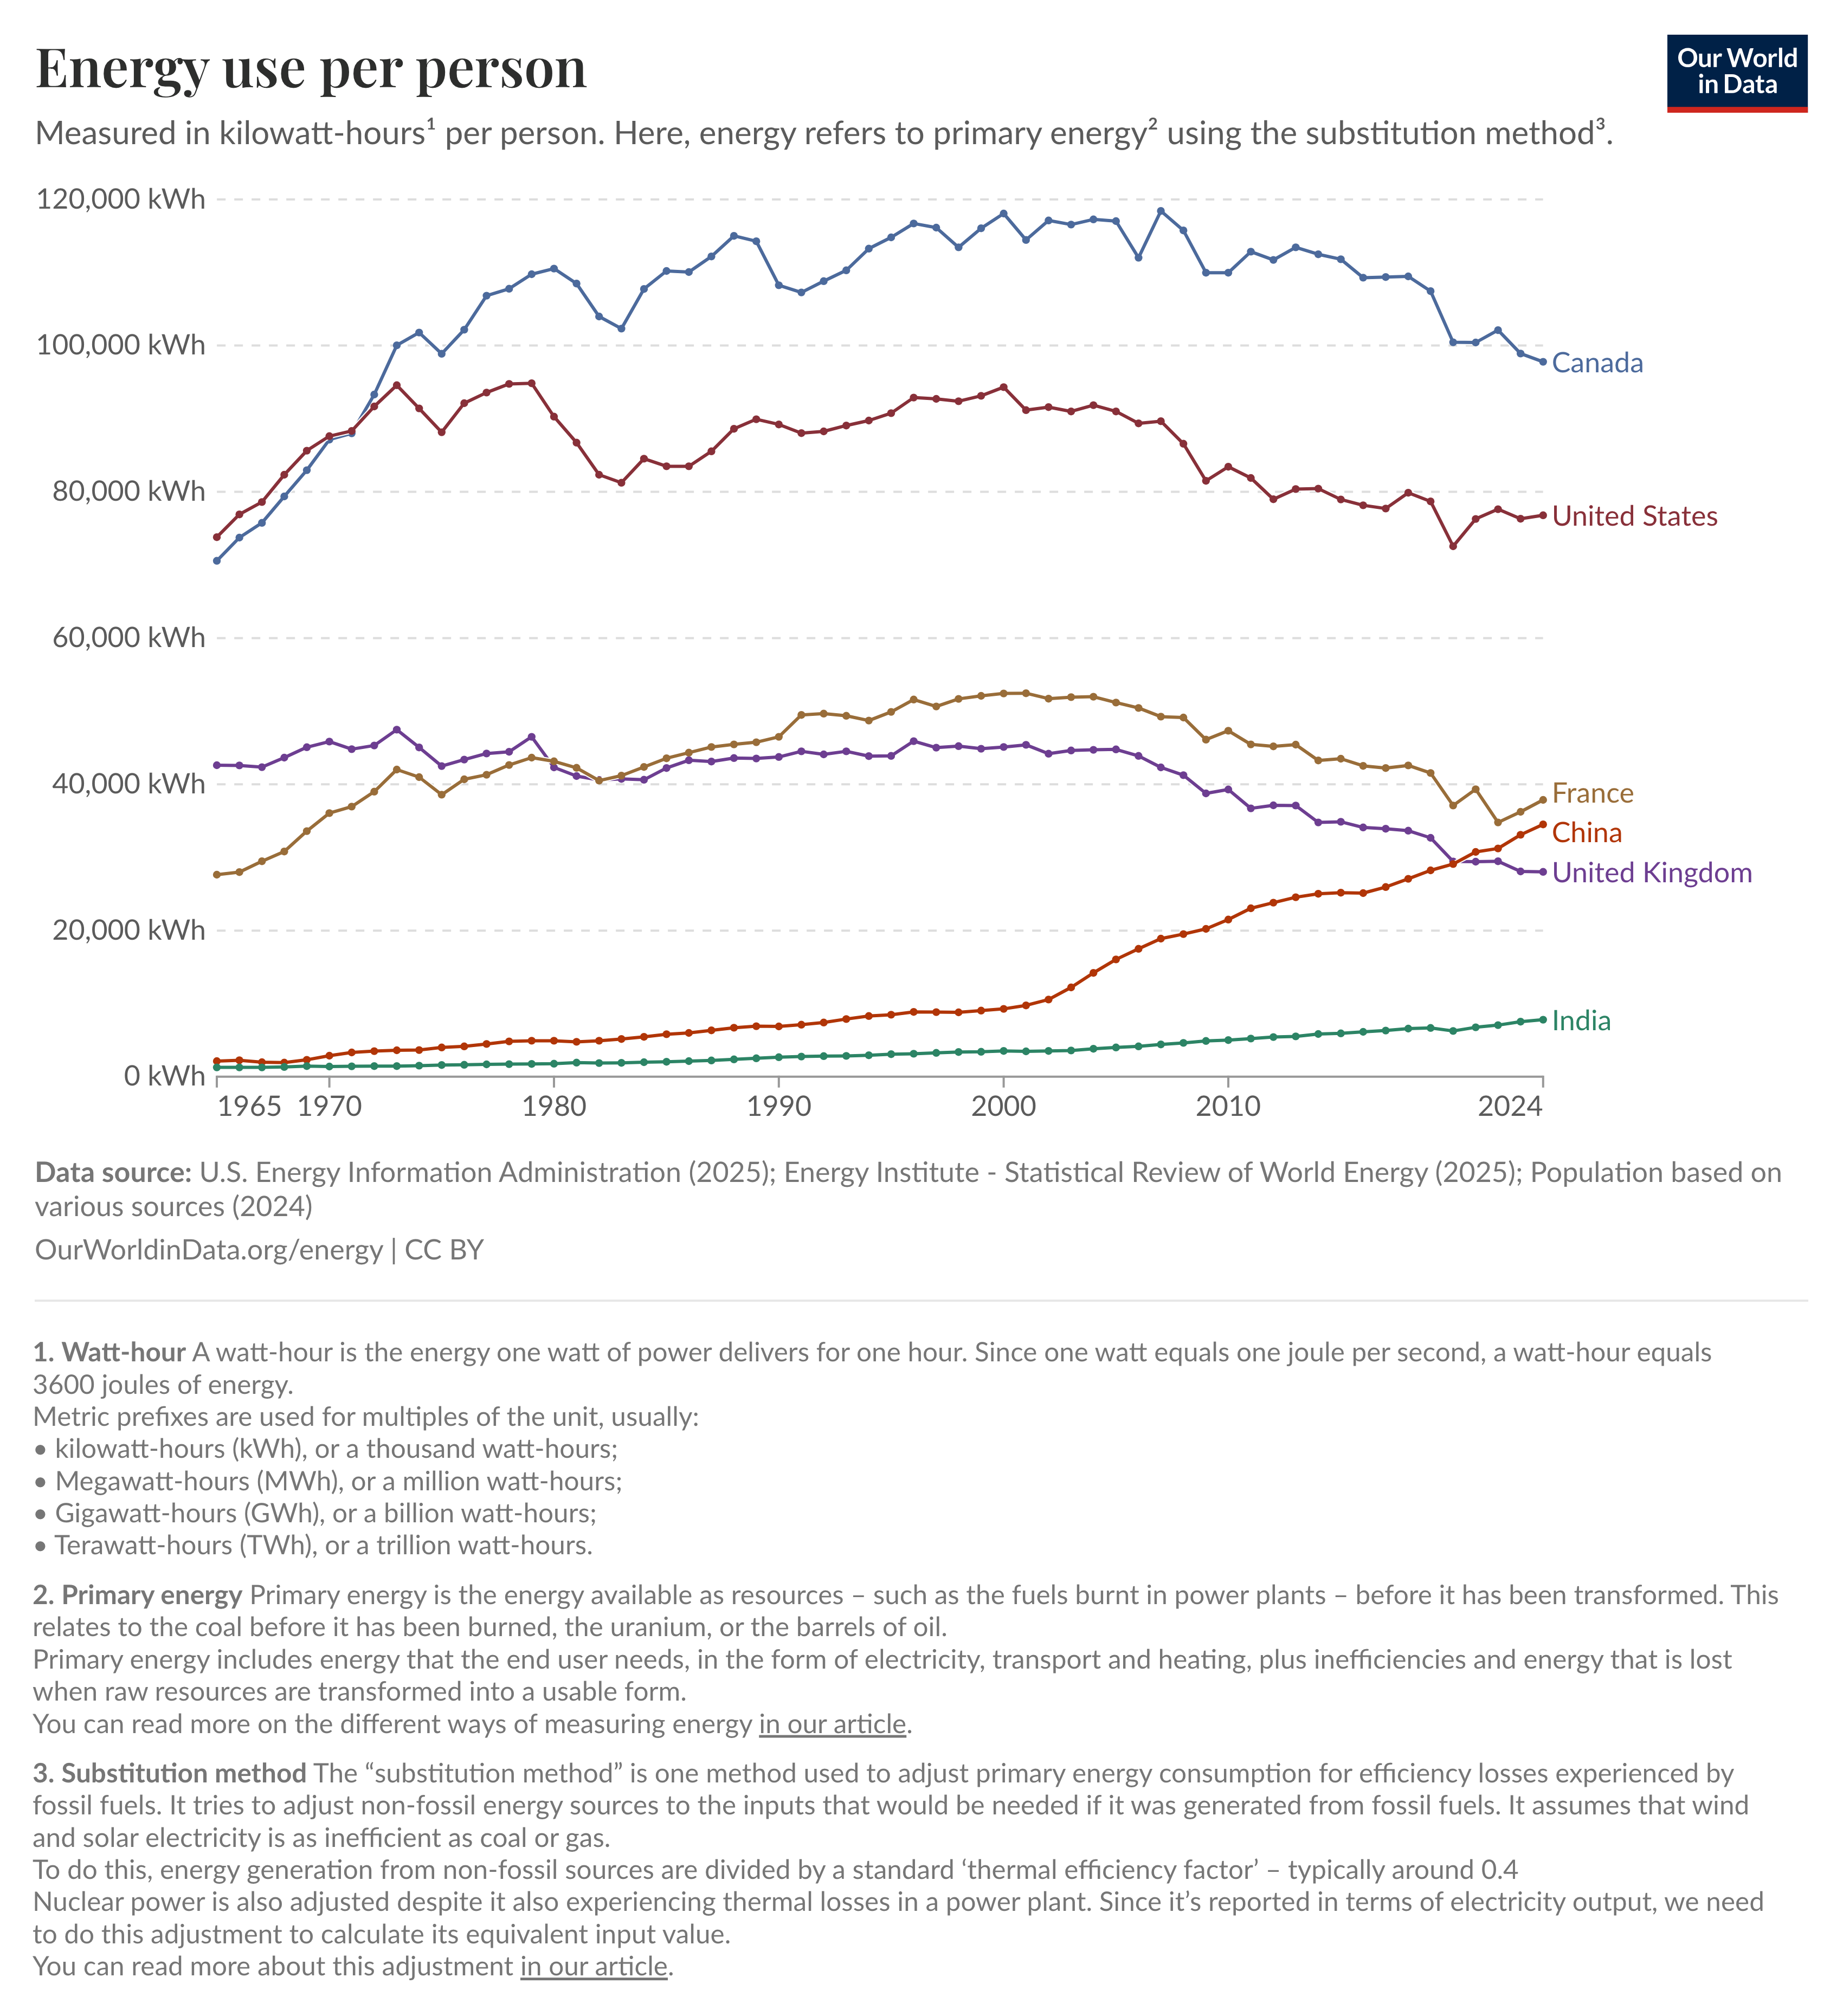
This question has been at the top of my mind for the last few weeks (waves hand in the air with everything going on), and I’ve gone in many different directions with possible responses. There is a chart I’ve come across from ourworldindata that, at first glance, looks like a fairly standard data visualization. A handful of lines moving across a timeline from 1965 to 2024, each one representing a country’s primary energy consumption per person, measured in kilowatt-hours. Canada is at the top, hovering near 100,000 kWh. India is near the bottom, just under 8,000. The United States has been slowly declining from its peak in the early 2000s (which prompted my interest in this question in the first place). China is bending upward in a long, steep arc that began sometime in the 1980s.
Sit with it long enough (like a black walnut tree in a Spartanburg backyard), though, and the chart starts to feel less like a data visualization and more like a kind of metabolic portrait... a way of asking how much of the Earth each way of life requires in order to sustain itself. Not in the abstract sense of carbon footprints or emissions inventories, but in something more fundamental way of how much energy has to move through the systems surrounding a single human life for that life to function as it currently does.
That question has a way of opening everything else.
The most striking feature of the chart, in my opinion (once you start pressing on it), is not the highest line or the lowest. It is what happens to the lines of the wealthiest countries around the turn of the millennium. The United States peaked near 95,000 kWh per person in the early 2000s and has since gradually declined, settling now around 76,000 kWh per person. The United Kingdom drops even more steeply, from roughly 45,000 kWh in the mid-1970s to around 28,000 today. France plateaus and begins a modest decline. These are usually read as signs of progress... decoupling, efficiency gains, the promise that modern economies can grow while drawing less from the Earth.
But there is a complication sitting quietly inside a reading of the data and its representation in that manner.
When manufacturing moves offshore, the energy embedded in that manufacturing does not disappear. It relocates. The deindustrialization of the British economy and the offshoring of American manufacturing are not separable from China's steep upward arc during the same decades. These curves are entangled. What looks like efficiency from one vantage point may be, in significant part, displacement... the movement of extraction to somewhere less visible on the ledger (Barrett et al., 2013; Davis & Caldeira, 2010). The lines are not independent of one another (another problem with 2-dimensional graph representations of data). They are telling parts of a single story.
This matters for how we think about the apparently good news embedded in the chart. If the “decline” in wealthy-nation energy use reflects a genuine transformation of the underlying relationship to the Earth, then it is worth celebrating. If it reflects the relocation of that relationship to other bodies, other places, and primarily other watersheds, then the moral calculus looks considerably different.
There is a growing body of research that runs counter to a different assumption, one perhaps even harder to dislodge, as it is part of the current American mythology around progress.

The standard logic of development treats energy use as a reliable proxy for human flourishing. More energy, more well-being. “Drill, Baby, Drill!” The assumption runs so deep that it rarely needs to be stated. It is encoded in the very architecture of how we measure progress, from GDP growth to the Human Development Index in its earlier iterations.
But a number of researchers have been probing the actual relationship between energy consumption and measures of well-being, and what they are finding is more complicated. Steinberger and Roberts (2010), analyzing the relationship between energy use, life expectancy, and human development across countries and over time, found that the relationship follows a curve rather than a line. Up to a certain threshold, additional energy strongly correlates with improvements in health, literacy, and basic welfare. Beyond that threshold, the gains flatten considerably. You get diminishing returns. And the threshold at which this flattening begins is considerably lower than the consumption levels of wealthy industrialized nations.
Millward-Hopkins et al. (2020), modeling what a “decent living” standard might require for the global population, estimated that providing good material conditions for all 10 billion people projected by mid-century could be accomplished at roughly 40-50% of current global energy use... if that energy were distributed differently and organized around genuine need rather than throughput maximization. Rao and Min (2018) reached similar conclusions in their framework of “decent living energy,” identifying a floor beneath which material deprivation begins and noting that most wealthy-nation populations are living far, far above it.
What this suggests is disorienting if you sit with it (like a budding red maple tree here in our backyard as I type this)… high-energy societies might be able to reduce consumption significantly without significant losses in human flourishing. And societies like India, visible on the chart as that nearly flat green line running just above the x-axis, have legitimate claims to increased energy access as a matter of basic justice, claims that cannot be waved away by pointing to global emissions targets without addressing who has been drawing from the common store for how long (Shue, 1993).
This is, as Pope Francis frames it in Laudato Si’, a question of ecological debt... not just a technical challenge but a moral one, rooted in the asymmetry between who has driven the crisis and who is most exposed to its consequences (Francis, 2015).
None of this is visible on the chart, of course. The y-axis measures kilowatt-hours. It cannot measure soil depletion, river health, or what it feels like to live in a place where the water still runs clear. It has no way of registering what Robin Wall Kimmerer describes as the work of “becoming native to place”... the long, slow practice of learning to inhabit a particular piece of the Earth with something like genuine reciprocity (Kimmerer, 2013).
This is where the data starts to gesture toward something that data alone cannot carry.
The concept I have been working with in my own research, ecological intentionality, tries to name a mode of attentiveness that is prior to the ethical and political questions, though it does not leave them behind. Drawing on Edith Stein’s phenomenology of empathy and Henri Bergson’s account of duration, the idea is that human consciousness is capable of a genuine participatory opening toward the living world... not just instrumental calculation, not just stewardship, but something closer to what Whitehead called “feeling the feelings” of the others with whom we share a world (Whitehead, 1929). Whether that kind of attentiveness can be cultivated at a civilizational scale is an open question. But the chart suggests that the alternative... continuing to treat energy throughput as the measure of a good life is running into the limits of its own logic.
It is easy to read a chart like this at a distance. From somewhere general. From “the global economy,” “industrialized nations,” or “the energy transition.”
But the abstraction collapses if you bring it closer.
In Spartanburg, the energy curve is not abstract. It is visible in the recent public controversy over (the failed) Project Spero, a proposed AI data center that would have drawn significant additional water and electricity from local infrastructure, provoking genuine community pushback. It is present in the conversation about what the revitalization of Duncan Park means for our local watershed, with its many creeks and tributaries, and carries with it the memory of a very different relationship between this city and its waterways. It is there in the question of what it means to have the Catawba-Wateree and Pee Dee river systems dammed and managed primarily for industrial and agricultural throughput, when those same rivers ran for millennia as something closer to what Kimmerer might call relatives.
At that scale, the question the chart is asking me stops being statistical. Instead, a better question might be what does this place require of us? And what are we requiring of it?
The researchers working on decent living energy thresholds are not, by and large, making theological arguments. They are running models to estimate caloric needs, build materials, and develop healthcare infrastructure. But the questions their work opens onto are ones that theology and philosophy have been circling for a long time, usually framed not as energy budgets but as something older… what constitutes a good life, and what does pursuing it obligate us toward?
Aristotle’s eudaimonia, Wendell Berry’s “membership,” Kimmerer’s “grammar of animacy,” the Laudato Si’ vision of integral ecology... these are not the same thing, and the differences between them matter. But they (along with me) share a suspicion of the assumption that more is better, that flourishing scales with throughput, that the good life can be measured in kilowatt-hours per person per year.
The chart does not settle any of this. But it does make the question harder to avoid.
References and Further Reading
Barrett, J., Peters, G., Wiedmann, T., Scott, K., Lenzen, M., Roelich, K., & Le Quéré, C. (2013). Consumption-based GHG emission accounting: A UK case study. Climate Policy, 13(4), 451–470. https://doi.org/10.1080/14693062.2013.788858
Davis, S. J., & Caldeira, K. (2010). Consumption-based accounting of CO₂ emissions. Proceedings of the National Academy of Sciences, 107(12), 5687–5692. https://doi.org/10.1073/pnas.0906974107
Francis. (2015). Laudato Si’: On Care for Our Common Home. Vatican Press. https://www.vatican.va/content/francesco/en/encyclicals/documents/papa-francesco_20150524_enciclica-laudato-si.html
Kimmerer, R. W. (2013). Braiding Sweetgrass: Indigenous Wisdom, Scientific Knowledge, and the Teachings of Plants. Milkweed Editions. https://milkweed.org/book/braiding-sweetgrass
Millward-Hopkins, J., Steinberger, J. K., Rao, N. D., & Oswald, Y. (2020). Providing decent living with minimum energy: A global scenario. Global Environmental Change, 65, 102168. https://doi.org/10.1016/j.gloenvcha.2020.102168
Rao, N. D., & Min, J. (2018). Decent living standards: Material prerequisites for human wellbeing. Social Indicators Research, 138(1), 225–244. https://doi.org/10.1007/s11205-017-1650-0
Shue, H. (1993). Subsistence emissions and luxury emissions. Law & Policy, 15(1), 39–59. https://doi.org/10.1111/j.1467-9930.1993.tb00093.x
Steinberger, J. K., & Roberts, J. T. (2010). From constraint to sufficiency: The decoupling of energy and carbon from human needs, 1975–2005. Ecological Economics, 70(2), 425–433. https://doi.org/10.1016/j.ecolecon.2010.09.014
Wainwright, J., & Mann, G. (2018). Climate Leviathan: A Political Theory of Our Planetary Future. Verso. https://www.versobooks.com/products/436-climate-leviathan
Whitehead, A. N. (1929). Process and Reality: An Essay in Cosmology. Macmillan. https://archive.org/details/processrealitygi00whit
Berry, W. (1987). Home Economics: Fourteen Essays. North Point Press. https://www.counterpointpress.com/dd-product/home-economics/
Oh, oh!
100,000 kWh of energy is ballpark equivalent to the number of calories baleen whales -- the huge guys -- use each year! It's hard to think that 300 million humans could use a lot of energy and resources, but how about 300 million huge whales? :)
One way of thinking of things is that only 1% of the energy we metabolize in North America is food energy. The other 99% of energy goes towards shelter, heating, transportation, digging resources, growing food etc.
- - - - - - - -
One very encouraging thing is that most of our energy comes from burning fossil fuels, in which process we lose 50% (combined cycle natural gas turbine) to 80% (gasoline car) of the starting energy, those starting kWh's. Part of the reason US energy intensity has gone down is the replacement of coal power plants (lose 70%) with natural gas power plants (lose 50%) -- and increasingly with renewable electricity, too.
Direct electrification has much fewer losses (call it 10% for electric transmission) so we can provide the same final energy needs ("drive 10 miles") with far less primary energy. So we can actually shrink that 100,000 kWh down a lot while still meeting our final energy needs!
- - - - - - - - -
We just have to avoid aiming for a utopia of 100% electrification (some people will still want fireplaces or gas cook stoves) because chasing utopias too hard, seems to be how we wind up in dystopias... 😅